Typical priceVerified
$295,921Typical market home valueCash-flow lean
Indianapolis-Carmel-Greenwood, IN
One of the clearer screening markets for investors who want rent coverage without coastal entry prices.
D47/100
Below-average marketD grade · 47/100 market scoreNeeds tighter selectivity and stronger basis than the average market.
Indianapolis remains useful because the public snapshot shows a much stronger rent-to-value relationship than the expensive metros, while still moving quickly enough to reward decisive buyers. It is a screening market, not an excuse to skip neighborhood diligence.
Average deal benchmark
Average deal in this market
This is the quick market-level baseline for what a typical deal looks like before you underwrite a real address.
Typical rentVerified
$1,553Average monthly rentRent-to-valueEstimated
6.30%Gross annual rent divided by home value1-year rent trendVerified
+2.4%Recent rent directionVerified metrics come from sourced market files. Estimated metrics are derived from those inputs.
County snapshot
Local context inside the market
These counties add local context after the market screen. Use them to see where conditions look stronger or weaker before you underwrite a specific address.
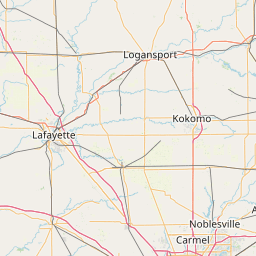
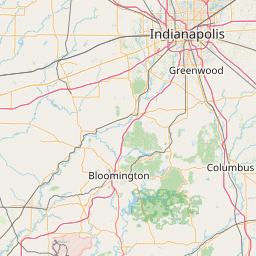
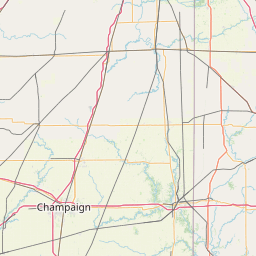
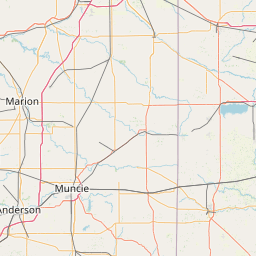
Leaflet © OpenStreetMap contributors
Shelby County · 70/100
Home value: $245,339Average rent: $1,276Rent-to-value: 6.24%
Marion County · 59/100
Home value: $234,041Average rent: $1,419Rent-to-value: 7.27%
Madison County · 58/100
Home value: $191,719Average rent: $1,070Rent-to-value: 6.69%
Morgan County · 54/100
Home value: $300,612Average rent: $1,677Rent-to-value: 6.69%
Sourced metrics
What the sourced market data says
RatingEstimated
47/100Weighted from rent-to-value, 1-year rent change, and price-vs-rent pressure. This is a screening heuristic, not a recommendation.Derived from Zillow Research inputs · 2026-05-31Home valueVerified
$295,921Metro typical home value from Zillow Research. 1-year change +1.3%.Zillow Research ZHVI (metro) · 2026-05-311-year valueVerified
+1.3%Directional value signal from Zillow Research, not a forecast.Zillow Research ZHVI (metro) · 2026-05-31Average rentVerified
$1,553Metro average rent from Zillow Research. 1-year change +2.4%.Zillow Research ZORI (metro) · 2026-05-311-year rentVerified
+2.4%Directional rent signal from Zillow Research, useful for underwriting assumptions.Zillow Research ZORI (metro) · 2026-05-31Rent-to-valueEstimated
6.30%Derived from Zillow Research rent and home-value inputs. This is a screening ratio, not cap rate or yield.Derived from Zillow Research ZHVI + ZORI · 2026-05-31Rating breakdown
How the screening score is built
Rent-to-value strength50% weight
6.30%Higher rent-to-value ratios improve the first-pass screen.1-year rent trend25% weight
+2.4%Positive rent growth improves the score.Price-vs-rent pressure25% weight
-1.1%When home values run ahead of rents, the score gets penalized.Underwriting
What this means for deal analysis
- A stronger gross rent-to-value ratio gives you more room to absorb realistic taxes, repairs, and management costs.
- Use the county snapshot to prioritize where to investigate, not to skip street-level diligence.
- The citywide snapshot supports screening for cash-flow potential, but neighborhood vacancy and tenant quality still drive the real outcome.
Verify before you buyMarket averages are a screen, not a verdict
Market averages are a screen, not a verdict
- Validate county-level rent comps and property taxes before relying on the metro snapshot.
- Check rehab scope carefully because older housing stock can turn a promising gross ratio into a weak net result.
- Model professional management even if you plan to self-manage so the deal survives a less optimistic operating setup.
MethodologyHow this page is built
How this page is built
- Numeric market metrics are pulled from Zillow Research metro files at build time, not copied by hand.
- County context uses Zillow Research county files plus Census TIGERweb county polygons so the local snapshot maps to real boundaries.
- The overall market score is a transparent screening heuristic built from rent-to-value, 1-year rent trend, and price-vs-rent pressure.
- Unsupported metrics such as days-to-pending are intentionally removed instead of scraped or inferred.
Zillow Research ZHVI metro file
Metro home values as of 2026-05-31.
Open sourceAccessed 2026-07-11Zillow Research ZORI metro file
Metro rents as of 2026-05-31.
Open sourceAccessed 2026-07-11Zillow Research ZHVI county file
County home values used for the supporting county snapshot.
Open sourceAccessed 2026-07-11Zillow Research ZORI county file
County rents used for the supporting county snapshot.
Open sourceAccessed 2026-07-11Census TIGERweb county polygons
Official county boundaries used to render the city-level map footprint.
Open sourceAccessed 2026-07-11Zillow research definitions
Reference definitions for Zillow housing and rent market metrics.
Open sourceAccessed 2026-07-11FAQCommon questions
Common questions
Why is Indianapolis highlighted on the map?
The Zillow-backed screening inputs tend to hold up better here than in the expensive metros, which makes it useful for first-pass buy-and-hold filtering before you move into a property analysis.
Why does this page show a score at all?
The market score is a transparent screening heuristic built from Zillow Research home-value, rent-trend, and rent-to-value inputs. It is not a buy recommendation or a substitute for address-level underwriting.
What do the county snapshots represent?
The page shows county-level snapshots inside the market footprint so you can see where conditions look stronger or weaker. Treat them as supporting context, not automatic buy boxes.
What should I do after reading this page?
Use the page to decide whether the market deserves deeper attention, then run a real property-level analysis inside InstantlyAnalyze before making an offer.