F52/100
F · 52/100
Monthly Cash Flow$59 /mo
Cash Needed$42.0k
CoC ROI1.68%
5-Year IRR5.33%
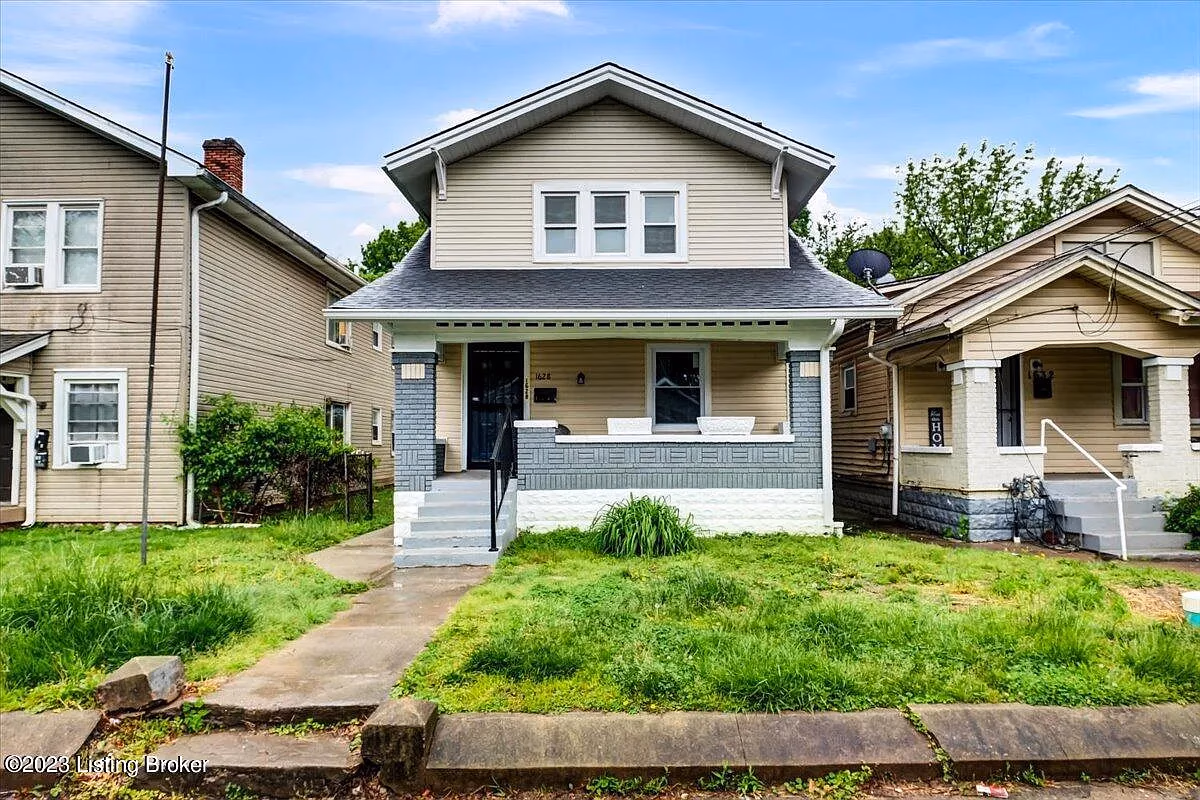
Property Overview
Property photo, address, and report actions.
Pick a path to compare against the baseline.
Choose a preset above to create your first strategy path.
See if the deal still works when rent, expenses, rates, or refinance assumptions move against you.
Review the expense assumptions, debt service, and long-term equity mechanics behind the report.
Market-backed assumptions
Comparing your current report inputs to local market data for Louisville, KY (as of 2026-05-31).
Source: Zillow Research ZHVI/ZORI · as of 2026-05-31
Expense Breakdown
Debt Service (P&I)
Taxes
Insurance
Budgeting Expenses
Fixed Expenses
Total Expenses
$1332
Debt Service (P&I)
$668Current purchase loan is included in debt service.
Refi unavailableTaxes
$142Insurance
$119Fixed Expenses
$125Electricity
$0Water & Sewer
$0Gas
$0Trash
$0Management
$125Budgeting Expenses
$278Vacancy
$70Maintenance
$139CapEx
$70 Loan Balance
Equity
Property Value
| Metric | - | Year 1 | Year 2 | Year 3 | Year 4 | Year 5 | Year 10 | Year 15 | Year 20 | Year 25 | Year 30 |
|---|---|---|---|---|---|---|---|---|---|---|---|
| Property Value | $130.0k | $132.6k | $135.3k | $138.0k | $140.7k | $143.5k | $158.5k | $175.0k | $193.2k | $213.3k | $235.5k |
| Equity | $39.1k | $42.4k | $45.9k | $49.5k | $53.2k | $57.1k | $78.8k | $105.3k | $138.4k | $180.8k | $235.5k |
| Loan Balance | $90.9k | $90.2k | $89.3k | $88.4k | $87.5k | $86.4k | $79.7k | $69.7k | $54.7k | $32.5k | $0 |
| Cash Flow | $59 | $73 | $88 | $103 | $119 | $135 | $218 | $310 | $412 | $524 | $648 |
| Mortgage Payment | $668 | $668 | $668 | $668 | $668 | $668 | $668 | $668 | $668 | $668 | $668 |
| Before Tax Equity Reversion | $31.3k | $34.5k | $37.8k | $41.2k | $44.8k | $48.5k | $69.3k | $94.8k | $126.8k | $168.0k | $221.3k |
| IRR (if held) | - | 3.11% | 6.80% | 8.01% | 8.59% | 8.91% | 9.42% | 9.49% | 9.47% | 9.43% | 9.39% |
| IRR (if sold) | - | -15.83% | -2.77% | 1.92% | 4.28% | 5.68% | 8.24% | 8.91% | 9.14% | 9.23% | 9.26% |
The calculators provided by this tool are intended for informational and educational purposes only, and should not be construed as investment advice. We strongly recommend consulting with a real estate professional before making any investment decisions. The results produced by this tool may not accurately reflect the actual returns of your investments. We are not liable for any decisions made based on the information provided by this calculator. Furthermore, we are not responsible for any errors or omissions, whether human or mechanical, in the calculations. This tool may use property details from third-party sources, and we do not guarantee the accuracy, completeness, or suitability of this information. It is your responsibility to verify that the property details used are accurate and appropriate for your specific use case.