Typical priceVerified
$202,440Typical market home valueCash-flow lean
Springfield, IL
This market can work, but only with tighter selection and less room for underwriting mistakes. In the latest Zillow Research data, home values are still rising while rents are still moving up.
D54/100
Below-average marketD grade · 54/100 market scoreNeeds tighter selectivity and stronger basis than the average market.
Springfield, IL is still moving on both price and rent, but values are running ahead of rent support. That makes it a better market for disciplined entries than for lazy underwriting.
Average deal benchmark
Average deal in this market
This is the quick market-level baseline for what a typical deal looks like before you underwrite a real address.
Typical rentVerified
$1,194Average monthly rentRent-to-valueEstimated
7.08%Gross annual rent divided by home value1-year rent trendVerified
+3.5%Recent rent directionVerified metrics come from sourced market files. Estimated metrics are derived from those inputs.
Strategy fit
What's working in this market
Springfield, IL is classified as a cash-flow market, with a 54/100 overall score that keeps it on the watch list rather than in clear buy-now territory. The strongest support in the numbers is income-based: rent-to-value strength is 7.08%, average rent is $1,194, and the market already carries Cash-flow lean and Rent support tags.
The tension is that prices are moving faster than rents. Typical home value is $202,440, with a 1-year home value change of +8.4%, while the 1-year rent trend is +3.5%. That creates +4.8% price-vs-rent pressure, meaning investors need to be careful not to let recent price growth erase the income advantage.
Which strategy this favors
This market currently favors buy-and-hold cash-flow investors most, because the 7.08% rent-to-value strength and $1,194 average rent provide income support, while the 54/100 watch-list score and +4.8% price-vs-rent pressure argue for disciplined deal selection rather than aggressive flipping or overpaying.
Generated from this market's real Zillow-backed metrics only — not a recommendation, and not informed by facts about the city beyond the numbers shown above.
County snapshot
Local context inside the market
These counties add local context after the market screen. Use them to see where conditions look stronger or weaker before you underwrite a specific address.
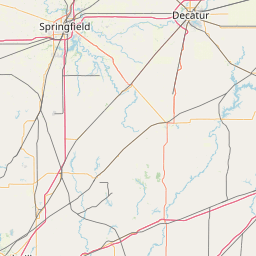
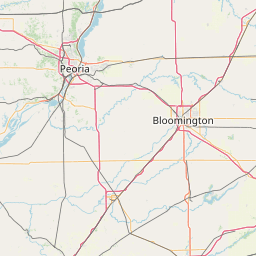
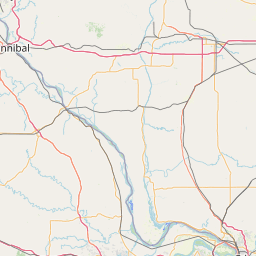
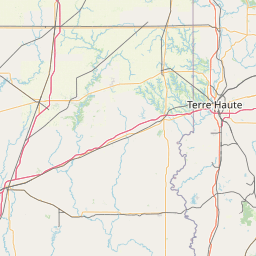
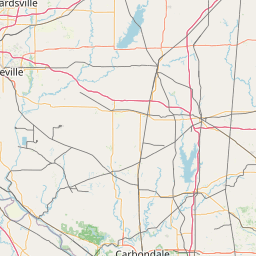
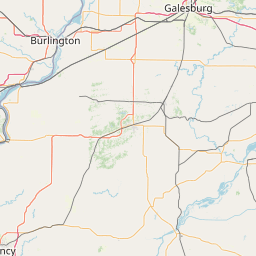
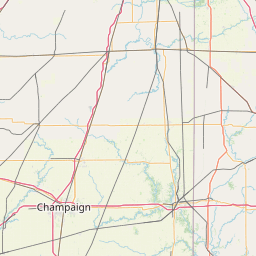
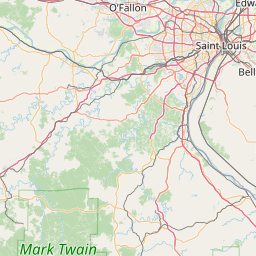
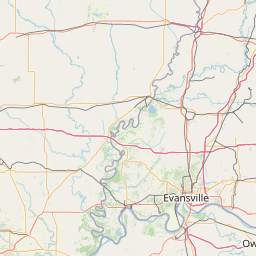
Leaflet © OpenStreetMap contributors
Sangamon County · 56/100
Home value: $201,554Average rent: $1,198Rent-to-value: 7.13%
Sourced metrics
What the sourced market data says
RatingEstimated
54/100Weighted from rent-to-value, 1-year rent change, and price-vs-rent pressure. This is a screening heuristic, not a recommendation.Derived from Zillow Research inputs · 2026-07-31Home valueVerified
$202,440Metro typical home value from Zillow Research. 1-year change +8.4%.Zillow Research ZHVI (metro) · 2026-07-311-year valueVerified
+8.4%Directional value signal from Zillow Research, not a forecast.Zillow Research ZHVI (metro) · 2026-07-31Average rentVerified
$1,194Metro average rent from Zillow Research. 1-year change +3.5%.Zillow Research ZORI (metro) · 2026-07-311-year rentVerified
+3.5%Directional rent signal from Zillow Research, useful for underwriting assumptions.Zillow Research ZORI (metro) · 2026-07-31Rent-to-valueEstimated
7.08%Derived from Zillow Research rent and home-value inputs. This is a screening ratio, not cap rate or yield.Derived from Zillow Research ZHVI + ZORI · 2026-07-31Rating breakdown
How the screening score is built
Rent-to-value strength50% weight
7.08%Higher rent-to-value ratios improve the first-pass screen.1-year rent trend25% weight
+3.5%Positive rent growth improves the score.Price-vs-rent pressure25% weight
+4.8%When home values run ahead of rents, the score gets penalized.Underwriting
What this means for deal analysis
- Use the market average as a screening shortcut, not a recommendation.
- Keep financing and exit assumptions disciplined because price pressure is outrunning the rent line.
- Do not turn market averages into cap-rate claims without real taxes, insurance, management, and repair assumptions.
Verify before you buyMarket averages are a screen, not a verdict
Market averages are a screen, not a verdict
- Validate listing-level rent comps before trusting the market average.
- Run financing and reserve assumptions with enough margin to survive a worse-than-average deal.
- Check whether the target county is outperforming or lagging the broader market before you bid.
MethodologyHow this page is built
How this page is built
- Numeric market metrics are pulled from Zillow Research metro files at build time, not copied by hand.
- County context uses Zillow Research county files plus Census TIGERweb county polygons so the local snapshot maps to real boundaries.
- The overall market score is a transparent screening heuristic built from rent-to-value, 1-year rent trend, and price-vs-rent pressure.
- Unsupported metrics such as days-to-pending are intentionally removed instead of scraped or inferred.
Zillow Research ZHVI metro file
Metro home values as of 2026-07-31.
Open sourceAccessed 2026-09-15Zillow Research ZORI metro file
Metro rents as of 2026-07-31.
Open sourceAccessed 2026-09-15Zillow Research ZHVI county file
County home values used for the supporting county snapshot.
Open sourceAccessed 2026-09-15Zillow Research ZORI county file
County rents used for the supporting county snapshot.
Open sourceAccessed 2026-09-15Census TIGERweb county polygons
Official county boundaries used to render the city-level map footprint.
Open sourceAccessed 2026-09-15Zillow research definitions
Reference definitions for Zillow housing and rent market metrics.
Open sourceAccessed 2026-09-15FAQCommon questions
Common questions
Why does this page show a score at all?
The market score is a transparent screening heuristic built from Zillow Research home-value, rent-trend, and rent-to-value inputs. It is not a buy recommendation or a substitute for address-level underwriting.
What do the county snapshots represent?
The page shows county-level snapshots inside the market footprint so you can see where conditions look stronger or weaker. Treat them as supporting context, not automatic buy boxes.
What should I do after reading this page?
Use the page to decide whether the market deserves deeper attention, then run a real property-level analysis inside InstantlyAnalyze before making an offer.