Understanding Cap Rate: The Key to Evaluating Real Estate Investments
The capitalization rate (commonly called the "cap rate") is the single most important metric in real estate investing. Whether you're analyzing your first rental property or managing a portfolio worth millions, understanding cap rate in real estate is essential. This metric is the universal language of real estate, letting investors, brokers, appraisers, and lenders quickly evaluate and compare properties across different markets and price points.
Professional insight: Cap rates are to real estate what P/E ratios are to stocks, a fundamental valuation metric that every serious investor must master. They're also easier to understand and more directly useful for decision-making than most people expect.
What Is a Cap Rate?
Definition and importance
A cap rate represents the relationship between a property's Net Operating Income (NOI) and its current market value or purchase price. It tells you what annual return you would earn if you bought the property with 100% cash, before accounting for financing, taxes, or appreciation.
Formula:
Cap Rate = Net Operating Income (NOI) ÷ Property Value
Example: Say you're considering a small apartment building:
- Purchase price: $500,000
- Annual rental income: $60,000
- Annual operating expenses: $25,000
- Net Operating Income (NOI): $35,000
- Cap Rate: $35,000 ÷ $500,000 = 7%
This 7% cap rate means the property generates a 7% annual return based on its net operating income, assuming you paid cash.
The role of cap rates in real estate
Cap rates come up at every stage of a real estate transaction. Sellers use them to justify asking prices, buyers to identify fair value and negotiate, and lenders to stress-test appraisals. Investors use them to compare properties across cities, property types, and price ranges without the noise of individual financing terms.
Because cap rates strip out debt service, they create a level playing field. Two investors with entirely different loan structures can evaluate the same property using the same cap rate and draw the same conclusions about its underlying income quality.
Cap rates also move with market conditions. When interest rates rise, cap rates typically rise too. Property values fall as investors demand higher unlevered returns to compete with bonds and other fixed-income alternatives. Tracking cap rate trends in your target market is one of the better leading indicators of where values are headed.
How Do You Calculate Cap Rate?
Cap rate calculation formula
The cap rate formula:
Cap Rate = NOI ÷ Property Value
Or, when you know the cap rate and want to derive value:
Property Value = NOI ÷ Cap Rate
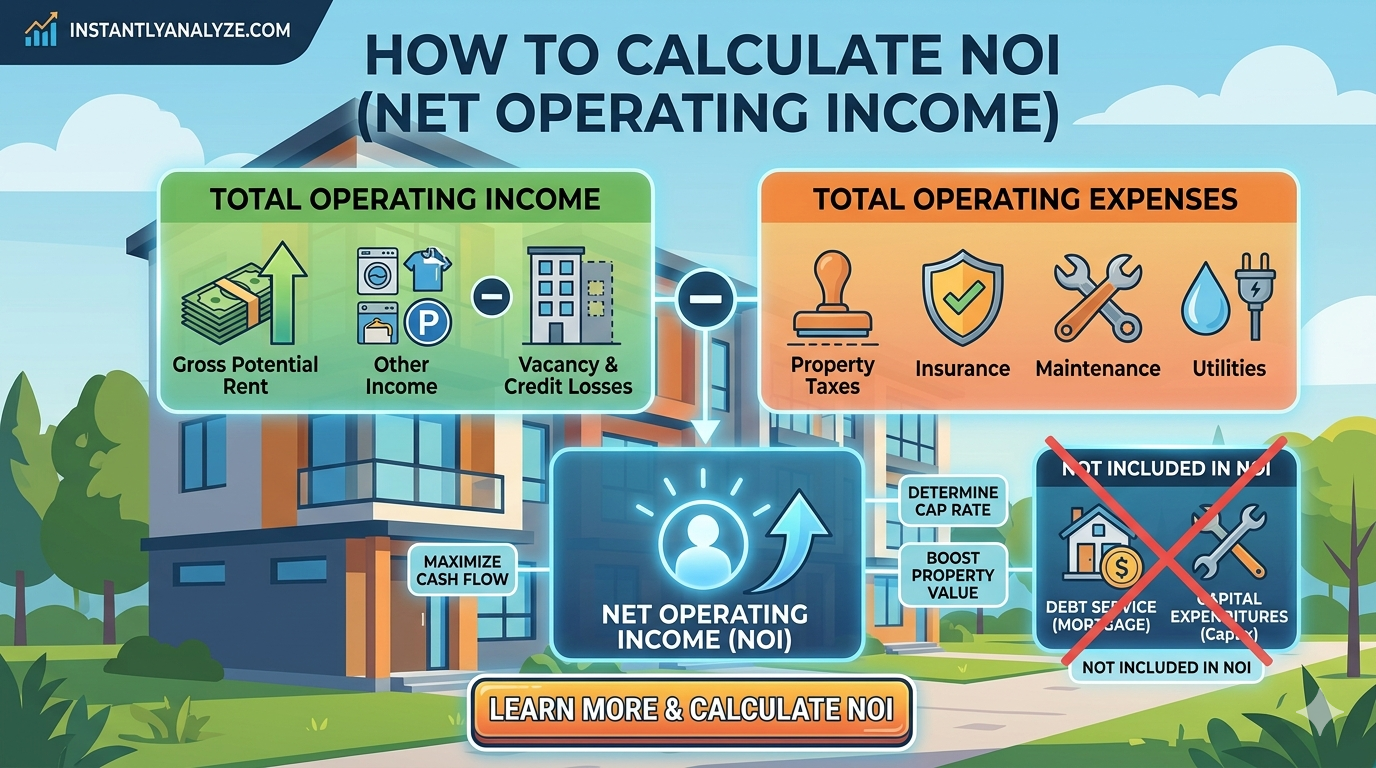
What counts as NOI?
NOI is gross income minus operating expenses. Here's what goes in each bucket:
Revenue (include):
- Rental income from all units
- Parking, laundry, storage, and pet fees
- Late fees and other recurring ancillary income
Operating Expenses (include):
- Property taxes, insurance, management fees
- Maintenance, repairs, and utilities (if owner-paid)
- Landscaping, pest control, marketing, legal, and accounting
Excluded from NOI:
- Mortgage payments (principal and interest)
- Capital expenditures (roof replacement, major renovations)
- Depreciation and income taxes
Mortgage payments are excluded, which is what makes cap rates universal. Financing terms vary by investor; NOI does not.
Step-by-step calculation process
Here's a full cap rate calculation with an 8-unit apartment building.
Property details:
- Type: 8-unit apartment building
- Purchase price: $1,200,000
- Monthly rent per unit: $1,100
- Current occupancy: 7 of 8 units rented
Step 1: Calculate gross rental income
8 units × $1,100/month × 12 months = $105,600 annual gross income
Step 2: Account for vacancy Even though only one unit is vacant now, budget for realistic vacancy:
Gross income: $105,600
Vacancy loss (5%): -$5,280
Effective Gross Income: $100,320
Step 3: Subtract operating expenses
Annual expenses:
- Property taxes: $15,000
- Insurance: $6,000
- Property management (8%): $8,026
- Maintenance & repairs: $8,000
- Utilities (common areas): $3,600
- Landscaping/snow removal: $2,400
- Pest control: $600
- Marketing: $1,200
- Legal/accounting: $1,500
- Reserves for CapEx: $8,000
Total Operating Expenses: $54,326
Step 4: Calculate NOI
Effective Gross Income: $100,320
Operating Expenses: -$54,326
Net Operating Income: $45,994
Step 5: Calculate cap rate
Cap Rate = $45,994 ÷ $1,200,000 = 3.83%
This 3.83% cap rate would be considered low in most markets. It either means the property is in a high-appreciation coastal area, or it's overpriced. Before making an offer, research comparable sales to find the prevailing market cap rate and calculate what the property should be worth.
What Are Cap Rates in Real Estate?
Types of properties and their cap rates
Cap rates vary by property type. Newer, higher-quality assets with stable tenants trade at lower cap rates because investors pay a premium for predictability. Older or more management-intensive properties carry higher cap rates.
| Property Type | Typical Cap Rate Range |
|---|---|
| Class A apartments (new, amenity-rich) | 3–5% |
| Class B apartments (well-maintained, older) | 5–7% |
| Class C apartments (lower-income, older) | 7–10% |
| Retail (anchored centers) | 6–8% |
| Office buildings | 6–9% |
| Industrial/warehouse | 5–8% |
| Single-family rentals | 5–10% |
These ranges shift as market conditions change. Industrial cap rates compressed sharply after 2020 as e-commerce demand pushed valuations higher. Office cap rates expanded as remote work changed demand dynamics. Always check current transactions in your specific submarket. Published ranges are starting points, not gospel.
Market variations in cap rates
Geography matters as much as property type. Gateway markets (New York, San Francisco, Los Angeles) consistently trade at lower cap rates because investors price in strong long-term appreciation and deep liquidity. Secondary and tertiary markets offer higher cap rates, but that yield premium comes with more risk, thinner buyer pools, and more volatile income.
| Market | Typical Cap Rate Range |
|---|---|
| San Francisco | 3–4% |
| Los Angeles | 4–5% |
| New York City | 3–5% |
| Phoenix | 5–7% |
| Dallas | 6–7% |
| Indianapolis | 7–9% |
| Cleveland | 8–11% |
| Detroit | 10–14% |
Never compare cap rates across different markets and declare one "better." A 4% cap rate in San Francisco reflects a different risk-return profile than a 4% cap rate in Detroit. Never forget which market you're in.
What Is a Good Cap Rate for Rental Property?
Factors influencing a good cap rate
The honest answer to "what is a good cap rate for rental property" is that it depends on your market, strategy, and required return. There is no universal benchmark that applies everywhere.
A few factors push a cap rate from "acceptable" to "good" in a given situation:
Lower cap rates tend to indicate:
- Safer, more stable markets with deep demand
- Higher-quality properties with creditworthy tenants
- Higher appreciation potential built into the price
- Lower expected cash flow but lower management burden
Higher cap rates tend to indicate:
- Higher risk and more active management requirements
- Lower property values with stronger immediate cash flow
- Higher vacancy exposure or deferred maintenance risk
- Lower appreciation potential
This tradeoff is real. Chasing a 10% cap rate in a declining market can destroy more capital than a 4% cap rate in a strong one. Vacancy, maintenance surprises, and a shrinking buyer pool can erode both income and exit value.
Your strategy matters too. A buy-and-hold investor who relies on cash flow to cover living expenses needs a higher cap rate than a long-term appreciation investor who can tolerate thin current yield.
Average cap rates in different markets
Current market benchmarks by region:
- Core gateway markets (LA, NYC, SF): 3–5% is the norm. Investors accept lower yields for appreciation upside and liquidity.
- Major Sun Belt markets (Phoenix, Dallas, Atlanta): 5–7% is typical. Reasonable balance of growth and yield.
- Secondary Midwest/Southeast markets (Indianapolis, Columbus, Charlotte): 7–9% is common. Higher cash flow, more management-intensive.
- Tertiary or distressed markets: 10%+ is possible but warrants extra scrutiny on fundamentals.
When evaluating a specific property, compare its cap rate to recent comparable sales in the same submarket and property class, not to national averages. If the property's implied cap rate is below market comps, it's priced at a premium. If it's above, there may be hidden risk or a genuine opportunity.
Using Cap Rate for Investment Decisions
Evaluating properties using cap rate
Cap rate's most direct use is working backward from market data to determine what a property is actually worth. If you know the prevailing market cap rate for comparable properties and you can estimate a property's NOI, you can determine its fair market value:
Property Value = NOI ÷ Cap Rate
Example: A commercial property generates $60,000 in annual NOI. Comparable sales show a 7% market cap rate.
Fair Market Value = $60,000 ÷ 0.07 = $857,143
If the seller is asking $950,000, the property is overpriced by roughly $93,000 (about 11%). That's your negotiation anchor. If the seller is asking $750,000 for the same property, it may represent genuine value, assuming your NOI estimate holds up.
This approach works in reverse for sellers too. If you've grown NOI from $60,000 to $75,000 and market cap rates have compressed from 7% to 6%, your exit price has jumped from $857,000 to $1,250,000, a 46% gain from both income growth and cap rate compression.
Comparing cap rates across different investments
Cap rate measures unlevered return. To compare it against your actual leveraged return, use cash-on-cash return.
Example — same property, two financing scenarios:
- Property value: $500,000
- NOI: $35,000
- Cap rate: 7%
Scenario 1: All Cash
- Cash invested: $500,000
- Annual return: $35,000
- Cash-on-cash return: 7% (matches cap rate)
Scenario 2: 75% Financing at 6%
- Down payment: $125,000
- Loan: $375,000 at 6% ($22,500 annual interest)
- Annual cash flow: $35,000 − $22,500 = $12,500
- Cash-on-cash return: $12,500 ÷ $125,000 = 10%
Here, leverage improved the return because the interest rate (6%) is below the cap rate (7%). This is called positive leverage. When the interest rate exceeds the cap rate, leverage works against you, which we cover in detail next.
Use the Properties Analysis Tool to calculate cap rates, cash-on-cash returns, and full ROI projections.
Downstream Impacts of a Good or Bad Cap Rate on Your Deal
Cap rate has real downstream effects on every phase of a deal, from initial offer through financing, hold period, and sale.
1. Purchase price negotiation
The valuation formula (Property Value = NOI ÷ Cap Rate) is your negotiation foundation. When a seller prices a property at an implied 5.5% cap rate but comparable sales support a 7% market cap rate, the math tells the story:
Seller's implied value: $60,000 ÷ 0.055 = $1,090,909
Market-supported value: $60,000 ÷ 0.07 = $857,143
That $233,000 gap is your negotiation anchor. You're presenting verified comp-based math, not guessing. A property priced above market cap rates is either in a uniquely strong location that justifies the premium, or it's overpriced. Knowing which is which is how you avoid paying someone else's premium.
2. Loan qualification and DSCR
Lenders look at more than your down payment. They check the property's ability to service debt. The metric is Debt Service Coverage Ratio (DSCR):
DSCR = NOI ÷ Annual Debt Service
Most commercial lenders require DSCR of at least 1.20–1.25. A property with a thin cap rate (and therefore thin NOI) can fail DSCR requirements even at a conservative loan-to-value. Some lenders apply a "stress cap rate" to the appraisal. If the market cap rate rises, they underwrite to a higher rate to see whether the value still supports the loan.
A 4% cap rate deal at 75% LTV with a 6.5% interest rate may not qualify for the financing you need. Run DSCR math before falling in love with a deal.
3. Positive vs. negative leverage
The relationship between cap rate and your financing rate determines whether debt is helping or hurting your returns:
- Positive leverage (cap rate > interest rate): Borrowing amplifies your cash-on-cash return above the cap rate. Debt is working in your favor.
- Negative leverage (cap rate < interest rate): Borrowing dilutes your return below the cap rate. You would do better buying with cash, if that were an option.
With interest rates in the 6–7% range, any deal priced at a sub-6% cap rate is operating in negative leverage territory for most financed buyers. That doesn't make the deal automatically bad (appreciation and loan paydown still contribute to total return), but it means cash flow will be thin or negative from day one.
4. Exit strategy and resale value
Your entry cap rate sets the baseline, but your exit cap rate determines what you sell for. If market cap rates expand between your purchase and sale (meaning investors demand higher yields), your exit price shrinks even if NOI grew.
Example:
- Purchase: NOI $50,000 at 6% cap rate → Value $833,333
- Exit (5 years later): NOI grew to $58,000, but market cap rates expanded to 7.5%
- Exit value: $58,000 ÷ 0.075 = $773,333
Despite 16% NOI growth, the property is worth less than you paid because cap rate expansion outweighed income growth. This is the core risk of buying at compressed cap rates in a rising rate environment.
Conversely, if cap rates compress from 7% to 5.5% over your hold, the same NOI growth produces a much larger gain:
Exit value: $58,000 ÷ 0.055 = $1,054,545
5. Hold period decisions
A property's cap rate relative to the market cycle should inform how long you hold it.
Buying at a high cap rate (market trough) means you have strong immediate cash flow but may not see rapid appreciation until the market recovers. Patience is the move. Hold long enough for cap rate compression to multiply your exit price on top of NOI growth.
Buying at a low cap rate (market peak) means appreciation is largely priced in already. Cash flow is the primary return driver, and it's thin. Shorter holds amplify risk because you need the market to stay favorable at exit. Longer holds give NOI time to grow, improving your exit cap rate relative to your purchase price.
6. Portfolio-level impact
A single low-cap-rate deal affects your portfolio's blended yield more than most investors realize. Mixing a 4% cap rate coastal asset with a 9% cap rate Midwest property gives you a blended 6.5%, but the risk profiles are not averaged symmetrically. The 9% deal may carry twice the vacancy risk, a heavier management burden, and a shallower buyer pool at exit.
Institutional investors track blended portfolio cap rates as a performance benchmark. As an individual investor, the practical takeaway: if you're adding a low-cap-rate asset, make sure you have a clear thesis for why the appreciation or quality premium justifies the yield sacrifice. "It felt safe" is not an investment thesis.
Conclusion
Cap rate is the starting point for real estate analysis, not the ending point. Used correctly, it tells you whether a property is priced fairly and what you can expect at exit. Used alone, it misses the full picture.
Combine cap rate with cash-on-cash return, market-level research, and a clear read on where you are in the cycle. Verify NOI rather than trusting seller projections, compare cap rates within comparable markets, and think through exit scenarios before making offers.
Use the Properties Analysis Tool to calculate cap rates, cash-on-cash returns, and full ROI projections on any property. Or explore our related guides on the 1% rule and the 50% rule for additional screening tools.
Free to use. No credit card needed. See cash flow, cap rate, and ROI in minutes.
Start Analyzing — FreeFrequently asked questions
Q: What are cap rates in real estate? A: Cap rates are a ratio comparing a property's net operating income to its market value. Real estate investors use cap rates to evaluate potential returns, compare properties across markets, and estimate property values without factoring in individual financing terms.
Q: How do you calculate cap rate? A: Divide net operating income (NOI) by the purchase price. NOI is gross rent minus operating expenses, but it excludes mortgage payments, capital improvements, and income taxes. For example, a property with $35,000 NOI and a $500,000 purchase price has a 7% cap rate.
Q: What is a good cap rate for rental property? A: It depends on the market. Strong cash-flow markets often see 7–10% cap rates on stabilized rentals, while appreciation-heavy coastal metros compress into the 4–5% range. Compare to local comparable sales before deciding—there is no universal "good" number.
Q: Does cap rate include mortgage payments? A: No. Cap rate is intentionally unlevered so investors can compare properties without personal financing distorting the picture. Use cash-on-cash return when you want to factor in debt service.
Q: How does cap rate affect your deal? A: Cap rate drives purchase price negotiation (via the NOI ÷ cap rate valuation formula), determines whether the deal passes lender DSCR requirements, dictates whether leverage is positive or negative, and directly determines your resale price if market cap rates shift before you exit.