Cash flow is the lifeblood of rental property investing. A property that cash flows gives you monthly income, financial security during vacancies, and the ability to hold long-term. One that doesn't can drain you. Here's how to calculate it accurately — and the most common mistakes that make investors underestimate their costs.
Cash flow = What's left over every month after collecting rent and paying every single expense, including the mortgage.
The Cash Flow Formula
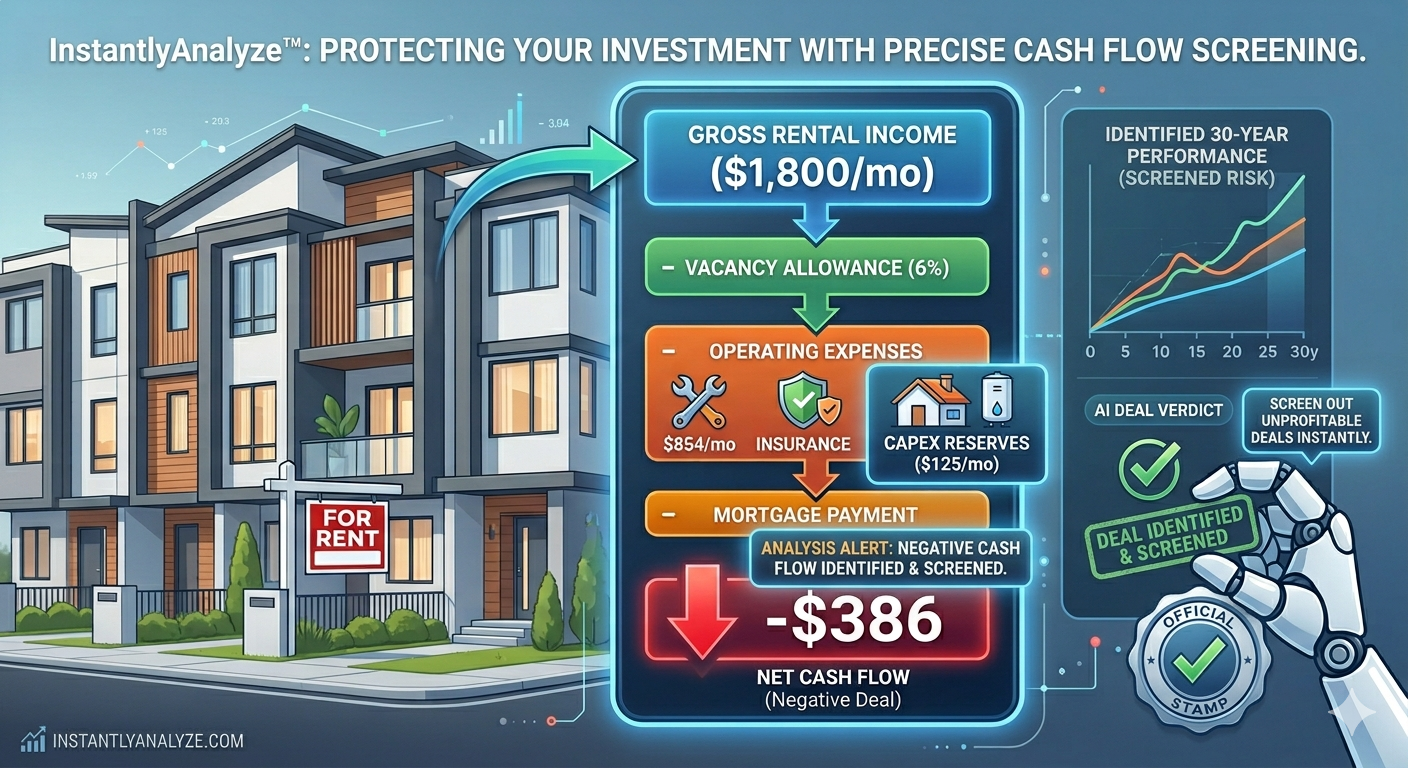
Net Cash Flow = Gross Rental Income
              − Vacancy Allowance
              − Operating Expenses
              − Mortgage Payment (PITI)
Let's break each line down.
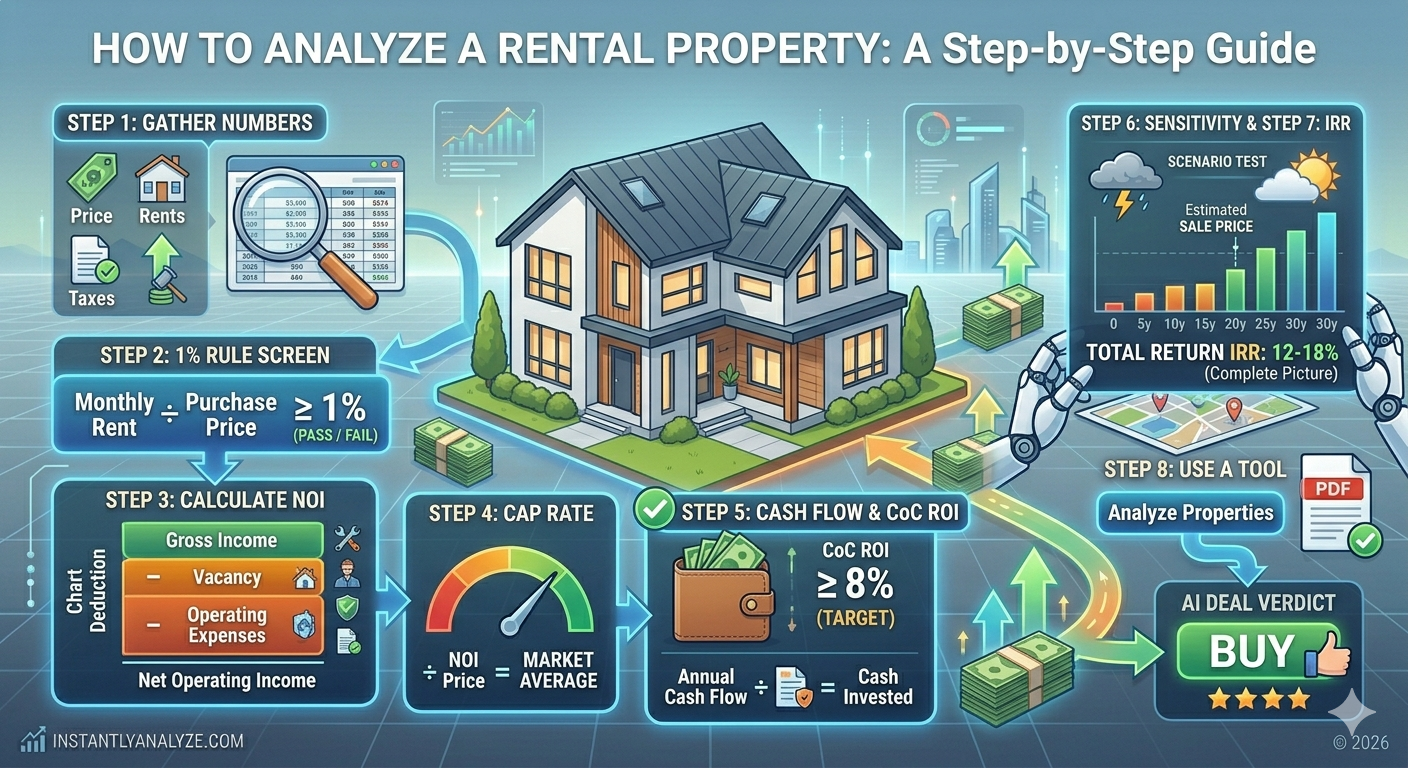
Step 1: Gross Rental Income
Start with the monthly rent you collect. If the property has multiple units, sum all rents.
Example: 3-bedroom single-family rental → $1,800/month
Annual gross rent: $1,800 × 12 = $21,600
Step 2: Subtract Vacancy Allowance
No property is 100% occupied every month. Budget 5–8% of gross rent for vacancy and credit losses.
Vacancy allowance (6%): $21,600 × 0.06 = $1,296
Effective Gross Income: $21,600 − $1,296 = $20,304
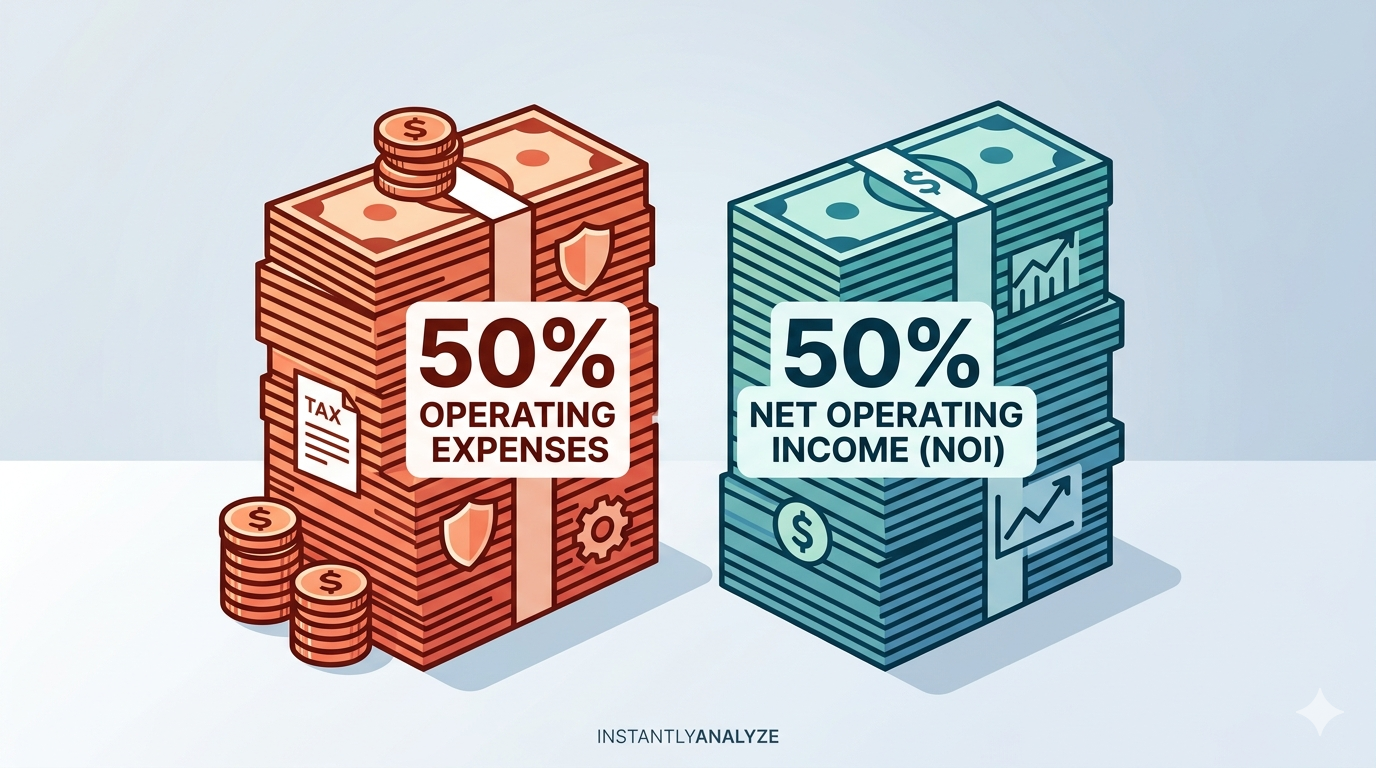
Step 3: Subtract Operating Expenses
This is where most new investors underestimate costs. Include all of:
| Expense | Monthly | Annual |
|---|---|---|
| Property taxes | $250 | $3,000 |
| Landlord insurance | $125 | $1,500 |
| Property management (8%) | $144 | $1,728 |
| Maintenance & repairs | $150 | $1,800 |
| CapEx reserves | $125 | $1,500 |
| Landscaping/snow | $60 | $720 |
| Total operating expenses | $854 | $10,248 |
Net Operating Income (NOI) = $20,304 − $10,248 = $10,056/year ($838/month)
Step 4: Subtract Mortgage Payment
With a 20% down payment on a $230,000 property:
- Loan: $184,000 at 7%, 30 years
- Monthly payment (P&I): $1,224
- Annual debt service: $14,688
Free to use. No credit card needed. See cash flow, cap rate, and ROI in minutes.
Start Analyzing — FreeStep 5: Calculate Net Cash Flow
Annual Cash Flow = NOI − Debt Service
Annual Cash Flow = $10,056 − $14,688 = −$4,632
Monthly Cash Flow = −$386
This deal loses $386/month — a cash flow negative investment. Whether it's still a good investment depends on appreciation, loan paydown, and your personal strategy.
What Does Good Cash Flow Look Like?
| Monthly Cash Flow per Unit | Assessment |
|---|---|
| > $300 | Strong cash flow |
| $100–$300 | Acceptable |
| $0–$100 | Breakeven — appreciation play |
| Negative | High risk unless strong appreciation market |
Operating Expenses You Can't Forget
Capital Expenditures (CapEx) is the expense most new investors skip. These are big-ticket items with long lifespans that need replacement eventually:
- Roof: $8,000–$15,000 every 20 years → $400–$750/year
- HVAC: $4,000–$8,000 every 15 years → $267–$533/year
- Water heater: $1,000–$2,000 every 12 years → $83–$167/year
- Appliances, flooring, exterior paint, etc.
Budget $100–$150/month per unit for CapEx reserves.
Cash Flow vs. Cash-on-Cash Return
Monthly cash flow tells you the absolute dollar amount. Cash-on-cash return tells you what percentage return that represents on your invested capital.
Annual Cash Flow: $2,400
Total Cash Invested: $50,000 (down payment + closing costs)
CoC ROI: $2,400 ÷ $50,000 = 4.8%
A higher CoC ROI means your cash is working harder.
Use a Calculator, Not a Spreadsheet
Manual calculations work, but they're slow and error-prone. Our Properties Analysis Tool:
- Calculates cash flow, cap rate, and CoC ROI automatically
- Adjusts for vacancy, expenses, and financing in real time
- Shows you 30-year projections with rent growth and appreciation
- Delivers an AI deal verdict in seconds
Conclusion
Accurate cash flow analysis requires including every expense — especially the ones that feel easy to skip, like CapEx reserves and vacancy. Most properties that "look good" at first glance break even or lose money when you run the full numbers.
Run the complete calculation before making any offer.
Calculate cash flow, cap rate, and CoC ROI instantly with our free rental property analyzer.