Analyzing a rental property correctly is the difference between a profitable investment and a money pit. Whether you're buying your first rental or your tenth, a disciplined analysis process protects you from expensive mistakes. This guide walks you through the complete process — from finding numbers to making your final decision.
The core goal of rental property analysis: Determine if the property will generate enough cash flow and long-term return to justify the risk and capital required.
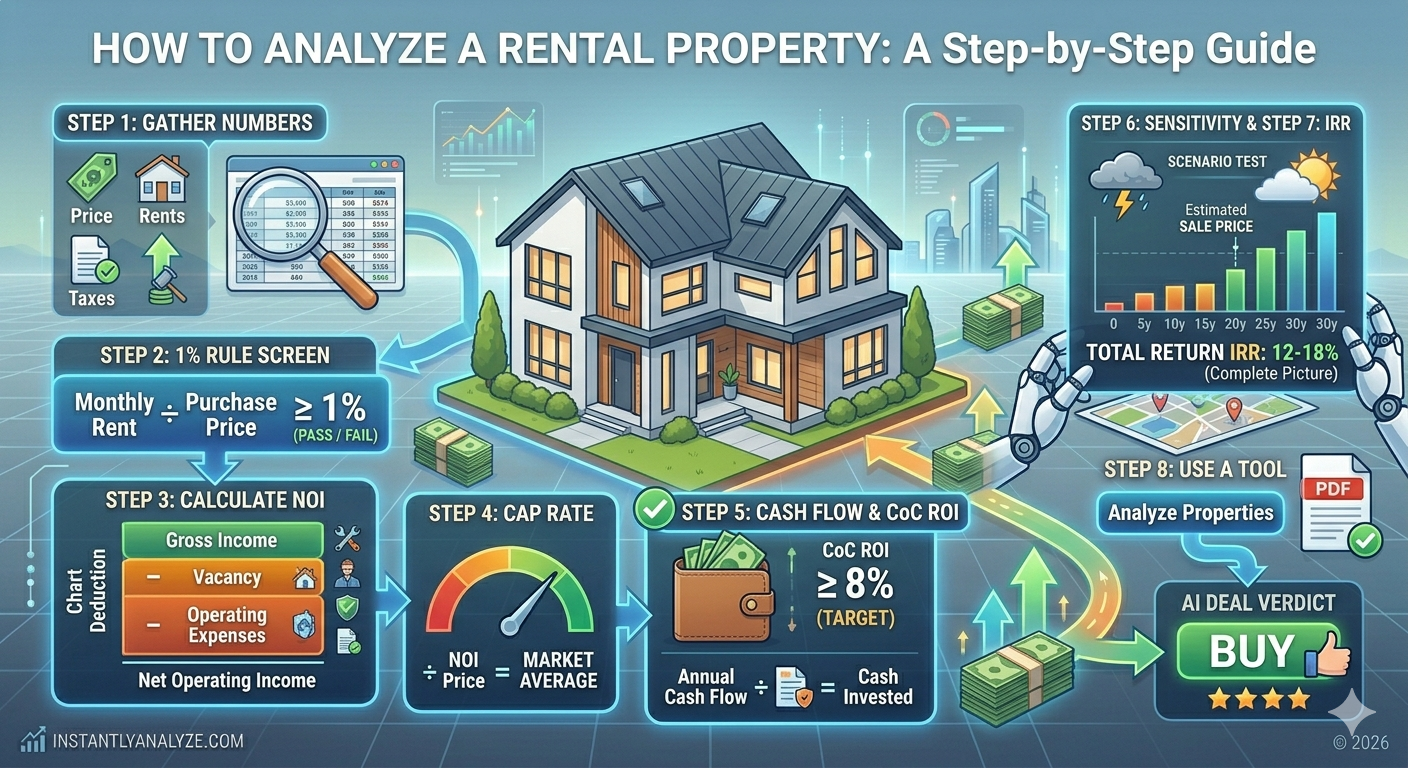
Step 1: Gather the Property Numbers
Before running any calculations, collect accurate inputs:
- Purchase price: The asking price, or your offer price
- Down payment: Typically 20–25% for investment properties
- Financing terms: Interest rate, loan term (usually 30 years)
- Gross monthly rent: Current rent or market rent for the area
- Property taxes: From the county assessor's website
- Insurance: Get a landlord insurance quote (typically $100–$200/month for SFR)
- HOA fees: If applicable
- Property management fee: Usually 8–10% of gross rent if you hire a PM
Pro tip: Never trust the seller's income and expense statements at face value. Verify rents against local comparables (Zillow, Rentometer) and get actual tax/insurance figures.
Step 2: Apply the 1% Rule as a Quick Screen
Before diving into a detailed analysis, apply the 1% rule as a quick filter.
Monthly Rent ÷ Purchase Price ≥ 1%
Example: A $200,000 property needs $2,000/month in rent to pass.
If a property doesn't pass the 1% rule, it's not necessarily a bad deal — but it needs more scrutiny to verify positive cash flow.
Step 3: Calculate Net Operating Income (NOI)
NOI is the foundation of every other metric. It measures the property's income after operating expenses but before debt service.
NOI = Gross Rental Income − Vacancy − Operating Expenses
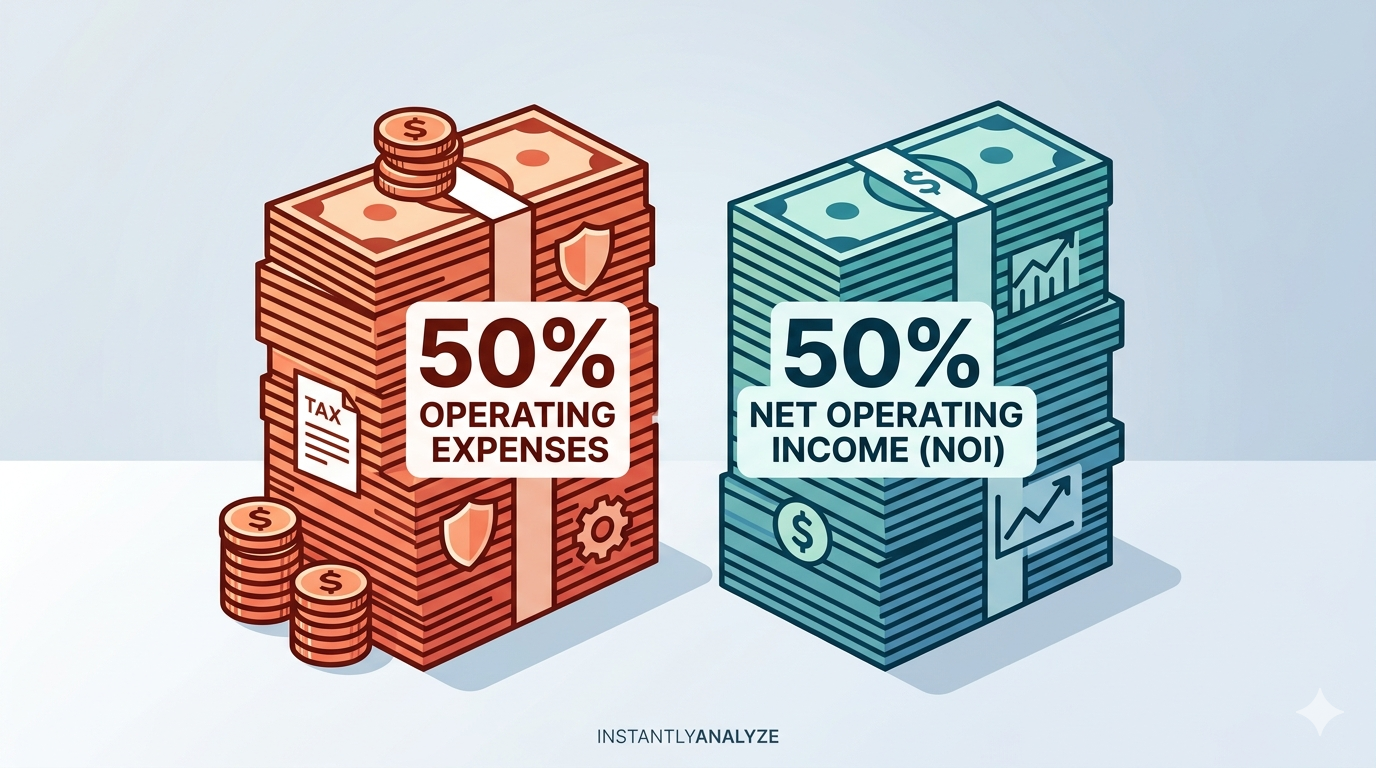
Typical operating expense breakdown (use the 50% rule as a starting estimate):
| Expense Category | Typical % of Gross Rent |
|---|---|
| Vacancy allowance | 5–8% |
| Property management | 8–10% |
| Property taxes | 10–15% |
| Insurance | 4–6% |
| Maintenance & repairs | 5–10% |
| CapEx reserves | 5–10% |
| Total | ~40–55% |
Example:
- Gross monthly rent: $2,000 ($24,000/year)
- Operating expenses (45%): $10,800
- NOI: $13,200/year
Step 4: Calculate Cap Rate
The cap rate tells you the property's unlevered return — what you'd earn if you paid all cash.
Cap Rate = NOI ÷ Purchase Price
$13,200 ÷ $200,000 = 6.6% cap rate
Compare this against market cap rates for similar properties in the area. A 6.6% cap rate might be excellent in Phoenix but mediocre in Indianapolis.
Step 5: Calculate Cash Flow and Cash-on-Cash Return
This is what actually hits your bank account after paying the mortgage.
Monthly cash flow:
Cash Flow = NOI − Monthly Debt Service
Example:
- Down payment (20%): $40,000
- Loan: $160,000 at 7%, 30 years → monthly payment ≈ $1,065
- Annual debt service: $12,780
- Annual cash flow: $13,200 − $12,780 = $420/year ($35/month)
Cash-on-cash return:
CoC ROI = Annual Cash Flow ÷ Total Cash Invested
$420 ÷ ($40,000 down + $3,000 closing costs) = 0.97%
This is thin. You'd want at least 6–8% CoC ROI for this level of risk.
Free to use. No credit card needed. See cash flow, cap rate, and ROI in minutes.
Start Analyzing — FreeStep 6: Run Sensitivity Analysis
Good deals hold up under stress. Test these scenarios:
- Vacancy: What if the property sits vacant for 2 months?
- Rent drop: What if market rents fall 10%?
- Rate increase: What if you refinance at a higher rate?
- Major repair: What if you face a $10,000 roof replacement in Year 2?
If the deal survives these scenarios with acceptable cash flow, it's robust.
Step 7: Calculate IRR for a Complete Picture
The Internal Rate of Return (IRR) gives you a total return figure that accounts for cash flow, appreciation, and eventual sale — all in one number.
Use a tool or spreadsheet to project:
- Annual cash flows over your hold period (e.g., 10 years)
- Estimated sale price at exit
- Sale costs (6% agent fees, etc.)
A good rental property typically targets 12–18% IRR over a 10-year hold.
Step 8: Use a Tool to Verify Everything
Manual calculations are error-prone. Use our Properties Analysis Tool to:
- Input your numbers and get instant cap rate, CoC ROI, and cash flow
- Run scenarios to stress-test the deal
- Get an AI deal verdict — buy, pass, or negotiate
- Export a PDF report to share with partners or lenders
Common Analysis Mistakes to Avoid
- Using gross rent without vacancy: Always deduct 5–8% for vacancy
- Ignoring CapEx: Budget $50–100/month per unit for major repairs
- Forgetting closing costs: These add $3,000–$6,000 to your cash invested
- Using rosy rent projections: Use current market rent, not projected
- Skipping the stress test: Know what happens when things go wrong
Decision Framework
| Metric | Pass | Caution | Fail |
|---|---|---|---|
| 1% Rule | ≥ 1% | 0.8–1% | < 0.8% |
| Cap Rate | > market avg | = market avg | < market avg |
| Cash-on-Cash ROI | ≥ 8% | 4–8% | < 4% |
| Monthly Cash Flow | > $200/unit | $0–$200 | Negative |
Conclusion
Analyzing a rental property well takes 30–60 minutes when you have the right inputs and a systematic process. The investors who consistently make money in real estate aren't smarter — they just analyze every deal the same disciplined way.
Start with the 1% rule to filter, calculate NOI and cap rate to value, and use cash-on-cash return to measure what your cash actually earns. Then use a tool like InstantlyAnalyze to verify your numbers and model scenarios in minutes.
Ready to apply this framework? Try our free rental property analysis tool — get cash flow, cap rate, IRR, and an AI deal verdict in under 2 minutes.